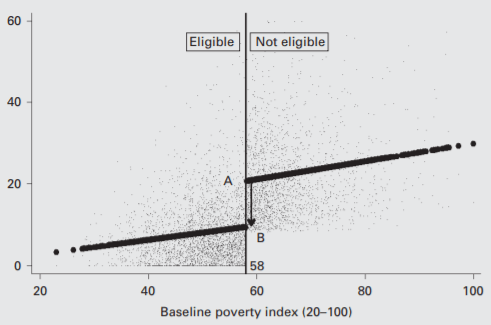
One method for evaluating the impact of a program is regression discontinuity design (RDD). This works when an intervention (to be evaluated) is assigned based on a score of some sort. For example, a welfare program that is assigned for all households below a certain level of income, or an education program that is assigned to all students above a certain test score (or below a certain test score). In short, this method compares individuals who are just above and below the cut-off for assignment to the program, since they are very similar (except for 1 or 2 points on a test or a small amount of income). You then adjust for those small differences statistically, but the intuition is that you’re comparing people who are very similar, except that one group gets the intervention.
When I teach impact evaluation, an activity where students get up and move around can be helpful for more at least two reasons: It can make a point visually, and it can keep people from falling asleep. Here’s an activity I came up with for demonstrating the concept behind RDD, and it has worked pretty well.
Tell the students that we are evaluating the impact of an injection that is supposed to increase the height of recipients. Every participant under a certain height will receive the injection. How can we evaluate it?
Have all the students line up in a row by height. (With a big class, use a subset of students.) Pick a couple of students of similar (but not identical) height in the middle and explain that this is the height cut-off. The shorter student on the left will receive the injection, and the taller student on the right will not.
Now, if we were to compare the height of the tallest student (to the right of the group) and the shortest student (to the left of the group), we wouldn’t have a good sense of the impact of the injection, since their heights are already so different. But if we compare those who are just below the qualifying height (getting the injection) to those just above (not getting the injection), then differences we observe are likely to be due to the injection.
I’ve done this activity with adults in more than one country, and it’s been effective and fun.
Any ideas for how you’d make this activity better? What activities do you use to teach impact evaluation methods?
The image at the top of this post is from Impact Evaluation in Practice (Second Edition).

Rather than having this be about a hypothetical injection, you could make it some sort of practical test that you can actually do in the classroom. For countries that aren’t as weight-conscious as the US, you could start off with a mystery weight (maybe a bag of sand) of unknown weight. People are told to line up by height. Each person in the class is weighed and someone (confidentially) records their weights. At some point a cut-off is made, and you have everyone on that side of the room be weighed while holding the mystery weight. You then plot the weights, and of course there will be natural variation because people of the same height vary in weight. But since weight typically goes up with weight, you can graph the difference in weights and see the mystery weight base on the discontinuity in the lines.
You could also do this with some other trait that varies with height, but I’m struggling to come up with a self-contained, easy to measure example. Maybe jumping height? You could measure the highest point on a wall each person can jump, going up with height, and then your intervention could be using a stepping stool of unknown/unmeasured height. You could then extract the height of your intervention by comparing jumping heights between the groups.
[…] in 20 minutes, introducing high school students to development economics with chocolate, and a practical activity for teaching regression discontinuity design that I’ve used with government workers in various […]