Development Economics in 20 minutes to high schoolers: This time with chocolate!

Two years ago I posted about a presentation I made to middle schoolers (seventh-graders, to be specific) on economic development.

This week I was asked to give a 15-20 minute presentation to a youth group of 14 and 15-year olds. Everyone seemed engaged, and they asked good questions. Here’s what I did.

1. I showed them the world’s income distribution using relatively recent data from Pew.

1 who has the money

2. Since it was clear I was going to focus on income — we had a short discussion of why money was important and what kinds of important things money could buy. After they shared their ideas, I listed a few, but they had already proposed many more.

2 what can money buy

3. Based on the income distribution data, I put each person in the room somewhere in the income distribution. I opened up an Excel sheet where I could enter the number of people in the room, and I had programmed it to — as I listed the name of each person in the room — assign them to an income group so that when I finished everyone in the room, it would reflect the global income distribution.

3 where do you fall

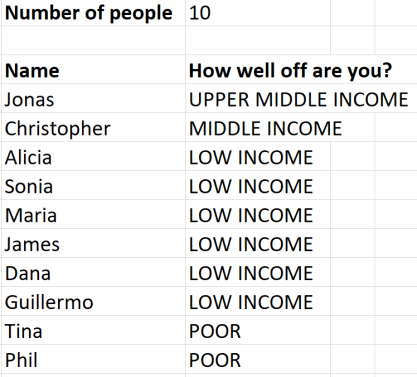
Then, to make it a little more concrete (and fun!), I distributed chocolate based on youth’s assigned income groups. So the upper-middle income youth got a chocolate bar, the middle income people got mini chocolate bars, the low income people got Hershey’s Kisses, and the the poor person got a single Hershey’s Dot (about the size of an M&M). [I actually forgot the Kisses, but that was how it was supposed to work.] If you’re budget conscious, like I am, I was able to finance the whole thing for a few dollars at a discount store.

4. I showed examples — using pictures from Dollar Street — of what households in each income group might look like. We talked about the housing materials.

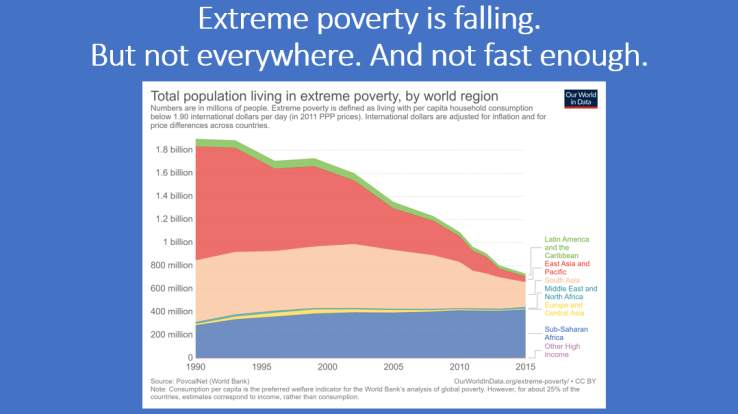
5. Extreme poverty has fallen dramatically, but there are still nearly 800 million people in the world who are extremely poor. So there’s a long way to go. (Thanks to Our World in Data for the figure!)

5 falling poverty

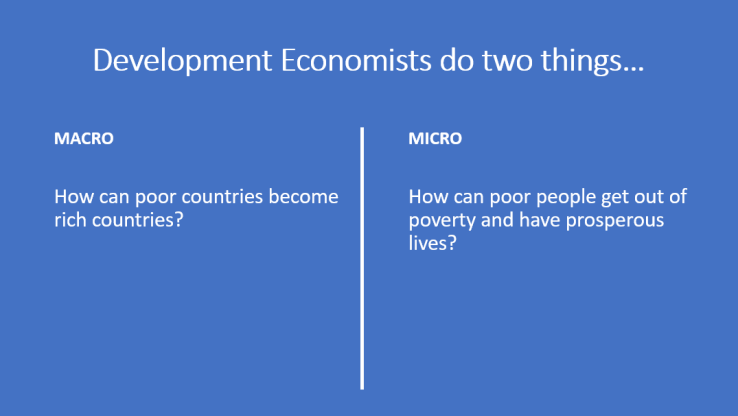
6. I talked through two sides to development economics, the macro (how can poor countries grow prosperous?) and the micro (how can poor individuals and families exit poverty and enjoy prosperity?).

6 devt economists

7. I asked them what they think makes a country grow? After they shared some ideas, I talked briefly about four types of capital.

7 what makes grow

8. I talked about three specific projects that I’ve worked on: (a) how Rwanda can get on a rapid growth path, (b) how Tanzania can implement an effective safety net, and (c) the economic impact of the Ebola epidemic of 2014.

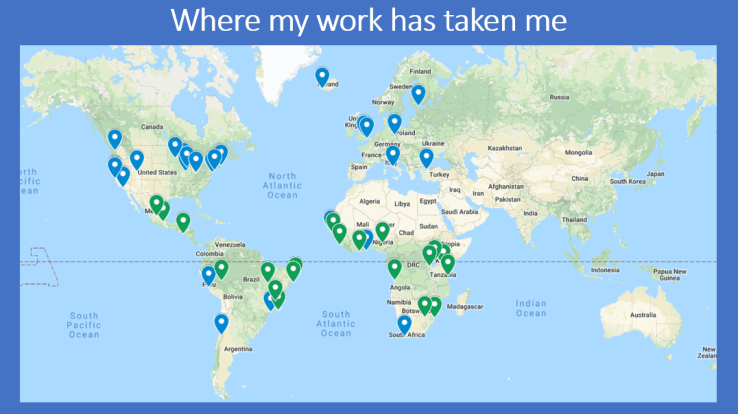
9. I talked a little bit about where my work has taken me. (Blue indicates conferences and seminar. Green indicates a research project or policy discussions.)

9 where to go

10. Finally, I talked about both my path to become a development economist, and a few of the other jobs that allow people to work in international development. Of course, there are many more! This was just to give a taste.

10 path

That’s it! It was fun. What have you done to explain these concepts to young people?

What else I’ve been writing

In addition to my reviews of (mostly African) writing here, I’ve been doing some other writing elsewhere. Check it out!

For deworming day, literature and research on avoiding and eliminating the worms

Today, on India’s National Deworming Day, I remember a striking passage from Jesmyn Ward’s powerful novel Sing, Unburied, Sing. Thirteen-year-old Jojo says,

sing unburied singEvery since Pop whipped me when I was six for running around the pen with no shoes on, I’ve never been barefoot out here again. You could get worms, Pop had said. Later that night, he told me stories about him and his sisters and brothers when they were young, playing barefoot because all they had was one pair of shoes each and them for church. They all got worms, and when they used the outhouse, they pulled worms out of their butts. I don’t tell Pop, but that was more effective than the whipping.

In Miguel and Kremer’s original paper on deworming in Kenya,

treatment schools received worm prevention education through regular public health lectures, wall charts, and the training of teachers in each treatment school on worm prevention. Health education stressed the importance of hand washing to avoid ingesting roundworm and whipworm larvae, wearing shoes to avoid hookworm infection, and not swimming in infected fresh water to avoid schistosomiasis.

But alas, “Health education had a minimal impact on behavior, so to the extent the program improved health, it almost certainly did so through the effect of anthelmintics rather than through health education.”

I’m not sure if Jojo was right or not, but in practice in the field, the education campaign wasn’t the answer. (Thankfully, the researchers didn’t try whipping!)

Happy deworming day!

Advice for impact evaluations with government: Drop the baseline

karthik2

This was a case where we did randomization without a baseline. I highly recommend this when you’re working with a government because the biggest risk is implementation failure. You’ll spend a lot of time doing the baseline – spend time, spend money – and have the intervention not be implemented. So when you’re working with the government, it’s better to get power by doubling the sample of your endline and just randomized with administrative data so you’ll get the same amount of power but you reduce risk up front.

That is Karthik Muralitharan speaking at the RISE conference today. Of course, he didn’t have to say that doubling your sample also increases your likelihood of randomization resulting in balanced intervention and comparison groups, thus making a baseline less necessary.

Update: This prompted a very active discussion on Twitter, which you can read in full here. Below are a few points.

Ultimately, there are a number of factors to consider — the potential sample size, the probability of implementation failure, the importance of baseline covariates for your analysis. But still, where there is serious concern that the program may not be implemented as expected — and especially if there are decent administrative data — it’s worth consideration. I’ll give the penultimate words to Karthik’s co-author, Abhijeet Singh.

First, responding to Pauline and Andrew’s point.

Second, to Cyrus and Seema’s points.

And the last word to Karthik himself.


There are many more comments, but I won’t embed them all here. You can read the full conversation here on Twitter.

Activity for teaching regression discontinuity design

One method for evaluating the impact of a program is regression discontinuity design (RDD). This works when an intervention (to be evaluated) is assigned based on a score of some sort. For example, a welfare program that is assigned for all households below a certain level of income, or an education program that is assigned to all students above a certain test score (or below a certain test score). In short, this method compares individuals who are just above and below the cut-off for assignment to the program, since they are very similar (except for 1 or 2 points on a test or a small amount of income). You then adjust for those small differences statistically, but the intuition is that you’re comparing people who are very similar, except that one group gets the intervention.

When I teach impact evaluation, an activity where students get up and move around can be helpful for more at least two reasons: It can make a point visually, and it can keep people from falling asleep. Here’s an activity I came up with for demonstrating the concept behind RDD, and it has worked pretty well.

Tell the students that we are evaluating the impact of an injection that is supposed to increase the height of recipients. Every participant under a certain height will receive the injection. How can we evaluate it?

Have all the students line up in a row by height. (With a big class, use a subset of students.) Pick a couple of students of similar (but not identical) height in the middle and explain that this is the height cut-off. The shorter student on the left will receive the injection, and the taller student on the right will not.

Now, if we were to compare the height of the tallest student (to the right of the group) and the shortest student (to the left of the group), we wouldn’t have a good sense of the impact of the injection, since their heights are already so different. But if we compare those who are just below the qualifying height (getting the injection) to those just above (not getting the injection), then differences we observe are likely to be due to the injection.

I’ve done this activity with adults in more than one country, and it’s been effective and fun.

Any ideas for how you’d make this activity better? What activities do you use to teach impact evaluation methods?

The image at the top of this post is from Impact Evaluation in Practice (Second Edition)

How does lowering the cost of schooling in early years affect later attainment?

School Costs, Short-Run Participation, and Long-Run Outcomes: Evidence from Kenya”: My paper with Mũthoni Ngatia is out as a World Bank Policy Research Working Paper. Here’s what we learned.

uniforms abstract

Even though primary education is “free” in many countries, families face many incidental expenses: uniforms, transport, and materials, among others.

cost

In Kenya, we worked with an NGO that provided free school uniforms to children to reduce the cost of schooling.

uniform

I know that you’re going to say: Do we need another study of “giving stuff” for education and how it affects attendance? Aren’t we supposed to be focused on learning and pedagogy?

learning

First, while attending school is no guarantee of learning, it’s a really important part of the process.

school

Second, we follow these students over 8 years. Few international education studies trace the time path of impact.

clock.gif

A school uniform can increase school participation by multiple means. Families don’t have to pay for the uniforms. AND students don’t feel stigmatized by being the only kid without a uniform.

duck

What do we find? In the short run, providing a school uniform does increase school participation.

yay

The impacts are particularly large for the poorest kids. Absenteeism drops by 15 percentage points for them, eliminating 55 percent of absenteeism for them.

yay2

But 8 years later, the children who participated in the program had no better educational outcomes than those who did not.

tear

Some educational interventions have long-lasting impacts: Smaller early-grade classes in the USA have translated into better college performance.

college

But we can’t assume it. In this case, initial gains in school participation do not translate into more school completion.

assume

And a few last words from the paper: “Take care when interpreting short-term results, taking into account these results and others which demonstrate that long-term impacts may vary – sometimes dramatically – from initial effects.”

changes

“Gathering long-term data is costly, but without it, the trajectory of impacts resulting from the wide range of interventions currently being implemented remains a mystery.”

batman

That’s it! Big short-term impacts for poor kids but disappointing long-term impacts. Check out the paper!

thank you


Can microcredit be profitable?

A new study by Burke, Bergquist, and Miguel suggests that it can. Not only that: it delivers positive spillovers. I write about it over at Let’s Talk Development.

Microcredit that helps more than just the borrower

Prices in African agricultural markets fluctuate a lot: “Grain prices in major markets regularly” rise “by 25-40% between the harvest and lean seasons, and often more than 50% in more isolated markets.” To an economist, this looks like a massive missed opportunity: Why don’t farmers just hold onto their harvested grain and sell at a much higher price during the lean season?

According to new work by researchers Burke, Bergquist, and Miguel, farmers in Kenya lack access to credit or savings opportunities, and so they “report selling their grain at low post-harvest prices to meet urgent cash needs (e.g., to pay school fees). To meet consumption needs later in the year, many then end up buying back grain from the market a few months after selling it.” It’s like the grain market is a very expensive source of short-term loans.

Can microcredit help? Offering farmers a loan at harvest led them to sell less at harvest time and to sell more grain later, when prices were higher. “The loan produces a return on investment of 28% over a roughly nine month period.”

Read more…

How do researchers estimate regressions with patient satisfaction at the outcome? A brief review of practice

Recently, Anna Welander Tärneberg and I were doing research with patient satisfaction as the outcome, and we checked how other researchers had estimated these equations in the past. Here is what we found, as documented in the appendix of our recently published paper in the journal Health Economics.

chart

People use a lot of different methods, and many authors use multiple methods. But there is a rich history of using Ordinary Least Squares regressions to estimate impacts on patient satisfaction. In our paper, we used OLS but verified all the results with Probit and Logit regressions. To add to this list, Dunsch et al. (including me) have a new paper out last week on patient satisfaction in Nigeria, also using OLS as the main estimation method.

Are patients really satisfied?

Yesterday, my new paper — Bias in patient satisfaction surveys: a threat to measuring healthcare quality — was published at BMJ Global Health. It’s co-authored with Felipe Dunsch, Mario Macis, and Qiao Wang.

Here’s a quick rundown of what we learned.

Many health systems use patient satisfaction surveys to gauge one key element of health services: the patient experience. As part of evaluating an intervention to improve health care management in Nigeria, we piloted patient satisfaction questionnaires.

bad gus fring GIF-downsized

A common way to measure patient satisfaction is to give patients a series of statements and to ask if they agree or disagree: “The clinic was clean.” “Staff explained your condition well.” That kind of thing. We noticed that people seemed to be agreeing with everything.

sesame street nod GIF-downsized

Was that because the quality of care was good, or because saying yes is just easier?

neil degrasse tyson whatever GIF-downsized

So we randomly assigned some patients to get the standard statements, and others to get negatively framed statements. “The clinic was dirty.” “Staff were rude.” “Staff explained your condition poorly.”

questions asking GIF by Grandfathered-downsized

Reframing the questions negatively led to significantly lower reports of patient satisfaction on almost every item.

sad inside out GIF-downsized

Sometimes the drops were big, as high as 12 percentage points and 19 percentage points.

leaving gene kelly GIF-downsized

Our work was in Nigeria, but a lot of patient satisfaction questionnaires that we reviewed from a lot of countries use this positive framing.

everybody shrug GIF by Harlem Globetrotters-downsized

But that likely gives a falsely optimistic view of the patient experience.

happy will smith GIF-downsized

Patient satisfaction questionnaires that either mix positive and negative framing, or that avoid agree/disagree formats can do better.

better GIF-downsized

Of course, the quality of care is much more than patient satisfaction. But good health care systems can and should offer a positive patient experience.

parks and recreation thumbs up GIF by HULU-downsized

Check out the paper!