Earlier this week I had 20 minutes each to speak to four classes of middle schoolers about my career. I talked about economic development. I used a presentation (available in full here). Given that it was the antepenultimate day of school, the students and teachers appeared very engaged.
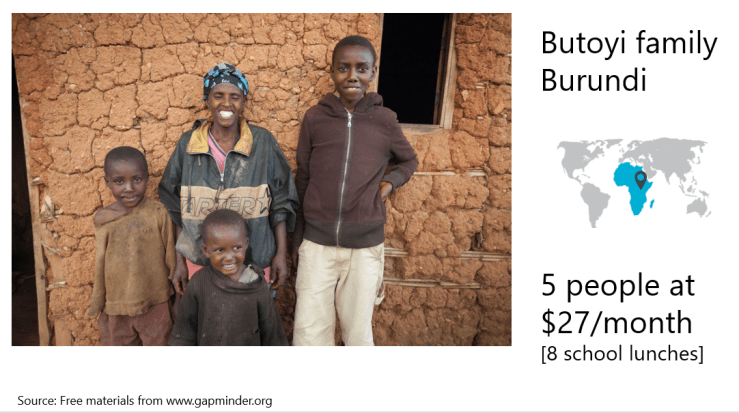
- I showed the students four families from Gapminder’s Dollar Street initiative — one from India, one from Burundi, one from Ukraine, and one from Colombia, and I had students vote (by raised hands) on which family they expected was poorest and which was wealthiest.

2. Then I introduced the four families in turn, and I expressed their monthly income in terms of the price of school lunches at the middle school where I was speaking. (The Ukrainian family’s monthly income was the equivalent of 3,100+ school lunches, more than the most insatiable student should ever consume.)
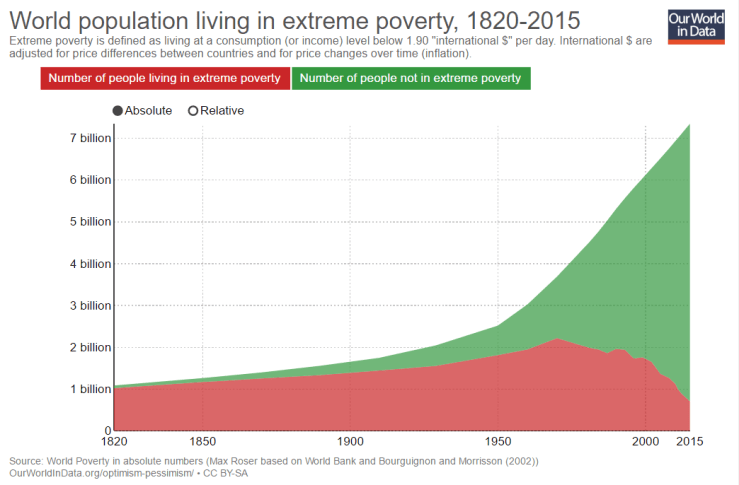
3. Having highlighted the massive gaps in income between families, I invited the students to vote (again, by raised hands) on the number of people in the world currently in extreme poverty. Hint: According to the latest estimates from Cruz et al. (2015), we’re at 700 million.

4. Then I showed — in two ways — how much poverty has decreased over time. First I showed the figure below from Our World in Data. I also showed the evolving chart on income and life expectancy from Gapminder. (Technical difficulties precluded showing the actual evolution over time, but at least I could show screenshots of the beginning and the end.)
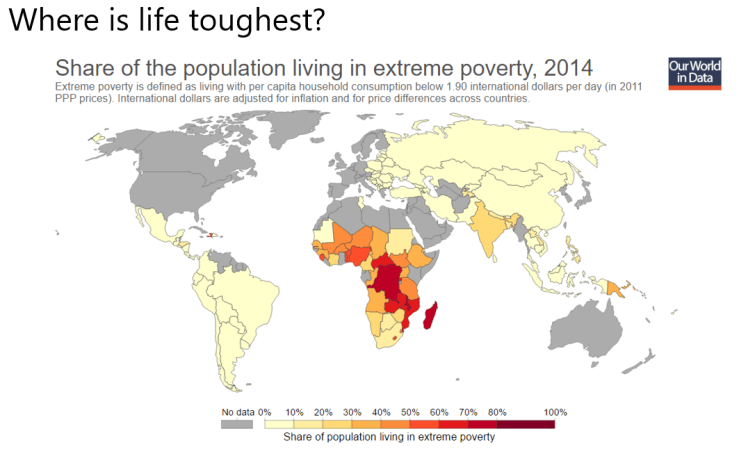
5. I then highlighted geographical concentrations of poverty.
6. Then I gave two very simple definitions of economics:
- Macro: Why are some countries rich and others poor
- Micro: How can poor families get out of poverty?
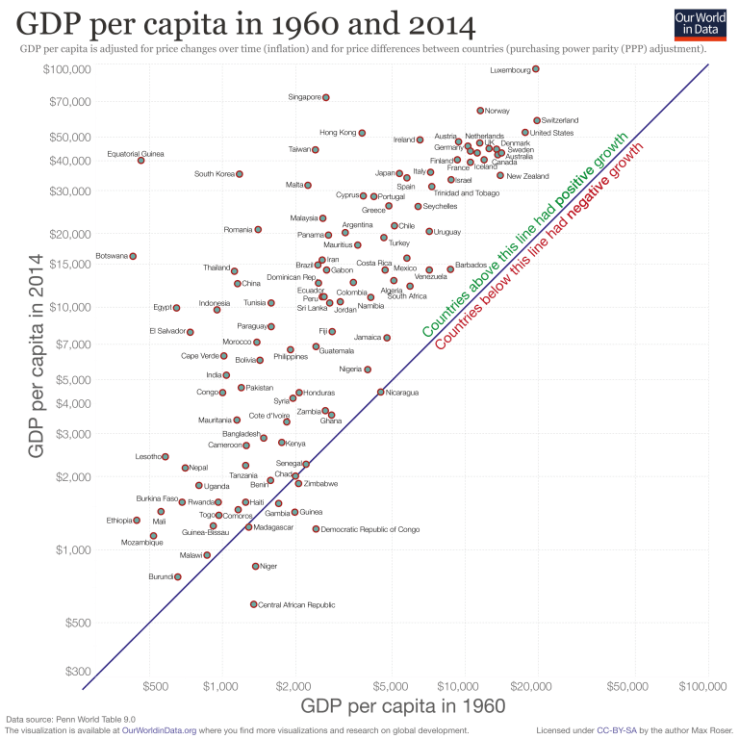
7. What does economic growth look like? Here’s some of the variation, where countries on the top left are those that grew the most: low income in 1960, high income in 2014.
8. I then invited the students to suggest what makes countries grow. We talked about a few possibilities.

9. We then returned to the growth map and differentiated between two high-growth countries: South Korea, which produces goods for trade (I had all the students with Samsung devices raise their hands) versus Equatorial Guinea, which produces a natural resource for trade (oil). We talked about the different implications for inequality.
10. I then talked through the two objectives of the World Bank: to encourage growth and to end extreme poverty. (To be more precise, the “twin goals” are to encourage “shared prosperity” — growth that benefits the bottom 40% of the population — and to end extreme poverty.)
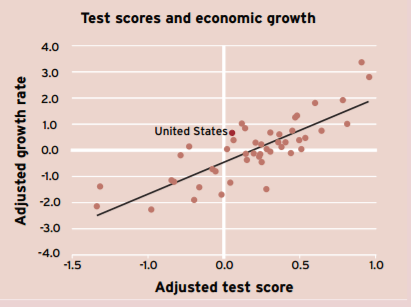
11. Then, since education is an area I work in actively, I highlighted the relationship between learning and economic growth, using data from Hanushek et al. (2008).
12. I then asked how many of the 7th graders could read a sentence: All of them claimed that ability. I then showed data from the Early Grade Reading Barometer on the percentage of 2nd graders in various countries who couldn’t read a single word, which of course predicts future literacy.
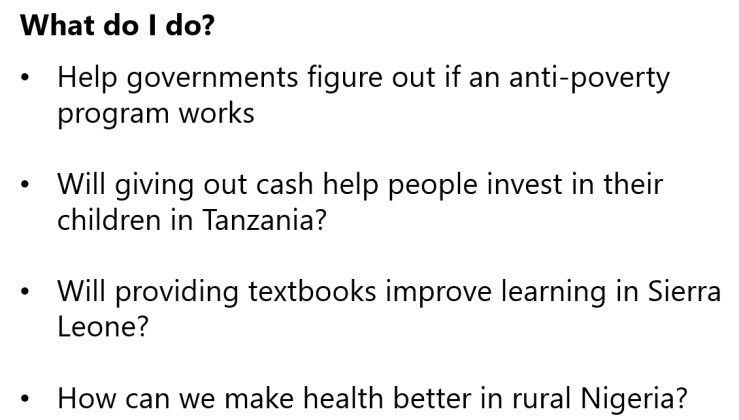
13. I talked about what I do specifically, with a few examples (including a few funny stories).
14. And finally, I talked them through how I got to my current job and reminded them that it’s not just economists working in international development.

Many thanks to all those who gave suggestions. I used several of them and would have enjoyed using others if I’d had more time (either to prepare or with the classes).
The next day, I received a number of thank you notes from students. This one took the cake.


Reblogged this on Joan Rosario Maria and commented:
Excelente publicación. Necesitamos personas que se dediquen a este tipo de educación para generar conciencia.
Great post. We need more people like you arround the World.
[…] years ago I posted about a presentation I made to middle schoolers (seventh-graders, to be specific) on economic […]
[…] to development economics to students of various types. In the past, I’ve written about introducing development economics to middle schoolers in 20 minutes, introducing high school students to development economics with chocolate, and a practical activity […]