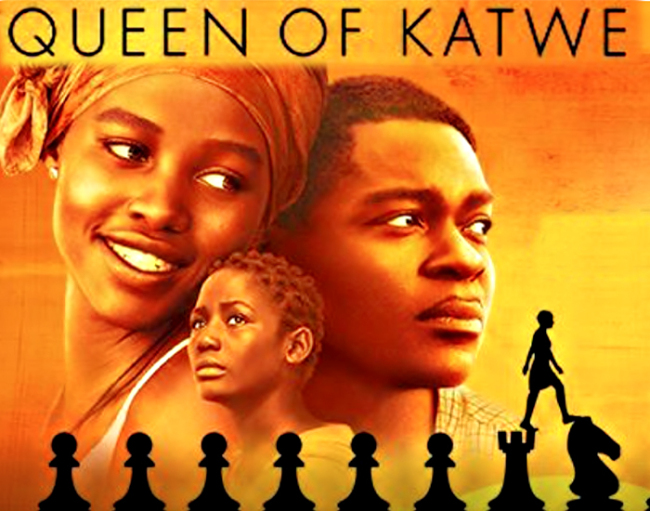
Over at Let’s Talk Development, I write about an experiment that showed an inspirational movie to Ugandan high school students and led many of them to pass their math exams:
How going to the movies helped Ugandan high schoolers pass their tests
Over at Let’s Talk Development, I write about an experiment that showed an inspirational movie to Ugandan high school students and led many of them to pass their math exams:
How going to the movies helped Ugandan high schoolers pass their tests
Some years ago, I was a graduate student in economics, and one of my advisors taught me that well-done tables, all at the end, will allow a reader to capture the entire narrative of your paper quickly.
On the other hand, if I’m actually reading the paper from start to finish, tables at the end mean constant flipping back and forth.
On the other other hand, when I’m going back to papers later, it’s much easier to find the results I’m looking for if the tables and figures are together in the back.
When I review economics papers (with tables at the back), I end up keeping two PDF files of the paper open at once, one open at the text and the other open at the tables and figures.
Last week Chris Blattman — a well-known development economist — posed the question to Twitter.

As you can see, the vast majority of respondents prefer tables interspersed throughout the paper. Now, it’s clear from responses to the tweet that not all respondents were economists. I suspect that most respondents were people who read economics papers, so if your goal is communicating with readers, this may be a useful metric. If your goal is to impress academic economists on hiring committees, who may or may not be well represented on Twitter (I don’t have a strong prior), then it may not be so helpful.
Discussants to the tweet highlighted the points I make above, that reading on a device is easier with tables interspersed, and that tables at the back make for easier skimming.
But I’d note that if you’re going to do tables at the back, do them right: Provide clear titles and notes such that the tables really can stand alone. As one economist noted, “Tables at the end are okay with decent notes, horrible without.”
If you have a website, a few people suggested having two versions, which is an interesting idea (and more work than I will credibly do).
So, writers, pick your poison. You’re likely to annoy at least a few readers either way!
I wrote a couple of items this week around the blogosphere:
Looking for a shortcut to identifying great teachers? You may be out of luck. On new evidence about the relationship between teacher performance on tests and student learning.
“The right data at the right time”: How to effectively communicate research to policy makers. A policymaker from Jamaica’s Ministry of Education shares insights on how to communicate your research.
I’ve wondered about this, so this week I posed the question to the twitterverse. Lots of people, including several journal editors, weighed in. (When I say editors, I include co-editors and associate editors.)
Here’s my take away: It doesn’t matter very much — and maybe not at all, depending on the editor. It’s certainly second (or third or fourth) order relative to the actual quality and relevance of your paper. But there may sometimes be a return to having the most well-known or senior author submit, so if it’s low-cost, then go for it.
Here are the details: I posed the question, “Do you believe it matters WHICH AUTHOR submits your co-authored paper to the journal?”
170 Twitter users weighed in, as follows:
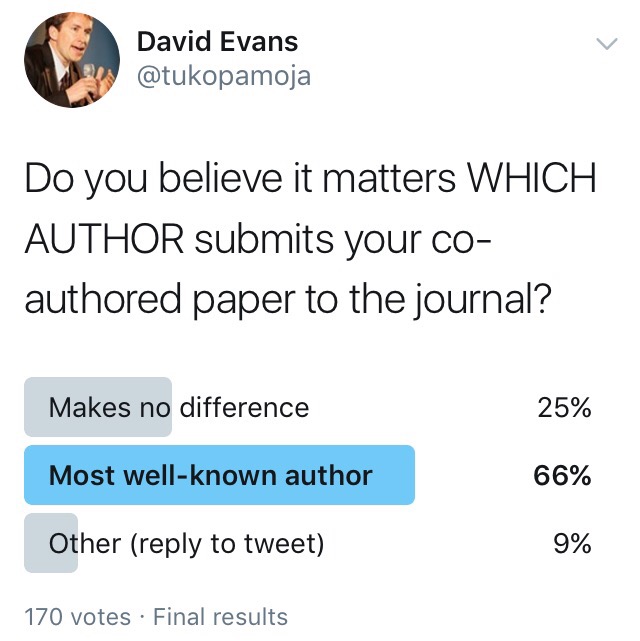
Of course, we don’t know who those 170 voters are or how much weight we should put on their opinions. (No offense to all you fine voters; I appreciate and value you!)
A few editors weighed in directly. One wrote: “Offering my *personal* perspective on this as editor. When better known submits it signals (to editor) their commitment to the paper.” She then clarified, “To be clear, not saying there’s a lot of info. I’m being honest that I do take epsilon more notice when a recognizable name submits.”
Another editor wrote (and a couple of others “liked”), “I’d say, don’t sweat the small stuff.” That’s in line with the first editor, who added, “Those mental cycles better spent on fine tuning the abstract, title and intro.”
Another editor wrote, “I don’t pay attention to which author submits. But now that I have the floor: I do remember super late or non-responsive referees.”
An academic weighed in, “For me, ‘lead’ author submits. When I lead, I submit. If my student leads the work, they should submit (this is how they learn).” This jives with what one of the editors wrote: “Ultimately, I think authors should take turns and let resources influence who submits. And I practice that.”
So there you go! I’ve left attributions off this post, but you can read the original discussion here.
 Rwanda is an exciting country with a tragic history. Before a recent work trip there, I asked the Twitterverse for book recommendations about the land of a thousand hills. Here is what I heard back, along with a few of my own. (Asterisks are on the ones I’ve actually read.)
On Rwanda today
On the genocide
Many thanks to Adolfo Avalos-Lozano, Sarah Baird, Danielle Beswick, Erika Edwards Decaster, Alice Evans, Andrew Gerard, Seva Gunitsky, Mike Holmes, Robert Marten, Jonathan Mazumdar, Gaby Saade, for Elisabeth Turner for suggestions.
[Updated 8/23/2017 at 2:30pm]
Over at Let’s Talk Development, I give my take on an interesting new study using school report cards.
Better information to improve service delivery: New evidence
Countries around the world have experimented with “school report cards”: providing parents with information about the quality of their school so that they can demand higher quality service for their children. The results have been mixed. Andrabi, Das, and Khwaja bring a significant contribution to that literature in last month’s American Economic Review with their article, “Report Cards: The Impact of Providing School and Child Test Scores on Educational Markets.”
Here’s the abstract: “We study the impact of providing school report cards with test scores on subsequent test scores, prices, and enrollment in markets with multiple public and private providers. A randomly selected half of our sample villages (markets) received report cards. This increased test scores by 0.11 standard deviations, decreased private school fees by 17 percent, and increased primary enrollment by 4.5 percent. Heterogeneity in the treatment impact by initial school test scores is consistent with canonical models of asymmetric information. Information provision facilitates better comparisons across providers, and improves market efficiency and child welfare through higher test scores, higher enrollment, and lower fees.”
Read my take at the original post!
3. The French version of my post, “A Framework for Taking Evidence from One Location to Another,” based on the work of Mary Ann Bates and Rachel Glennerster, is now available: Comment déterminer si un projet avec de bons résultats dans un pays fonctionnera ailleurs ?
4. The Portuguese version of my post, “Are good school principals born or can they be made?” based on the work of Roland Fryer and others, is now available: Os bons diretores da escola nascem ou podem ser criados?
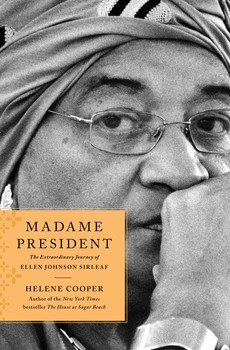 In 2005, Liberia elected its first woman president. Ellen Johnson Sirleaf was also Africa’s first elected woman president. (Guinea-Bissau and Burundi both briefly had women as acting presidents.)
Ben Piper reports on insightful work that he and co-authors have done comparing various education technology intervention in Kenya in terms of both effectiveness (do they improve reading ability?) and the cost-effectiveness (what’s the cost per reading gain?).
I recommend his full post (or the research paper it’s based on). Here are a couple of highlights:
When compared to traditional literacy programs, the more intensive ICT interventions did not produce large enough gains in learning outcomes to justify the cost. This is not to say that each of the ICT interventions did not produce improvements in students’ reading ability…. [But] the cost-effectiveness of all of these programs might still be significantly lower than a clear investment in high quality literacy programs…. In additional to monetary cost, an opportunity cost existed…. Many of the teachers, tutors, and students lacked exposure to technology and the time and energy spent on learning how to use the technology reduced the amount of time for instructional improvement activities.
When costs are considered, there are non-ICT interventions that could have larger impacts on learning outcomes with reduced costs; one such option could include assigning the best teachers to the first grade when children are learning how to read, rather than to the end of primary school as many schools do.
Economists will disagree with the standard errors if I understand the specification right: Randomization is at the district level and I don’t believe the authors cluster the standard errors.
But I don’t think that will change the fundamental message here: Even if there are some gains from education technology, we have to ask when they will be most likely to be worth the cost.
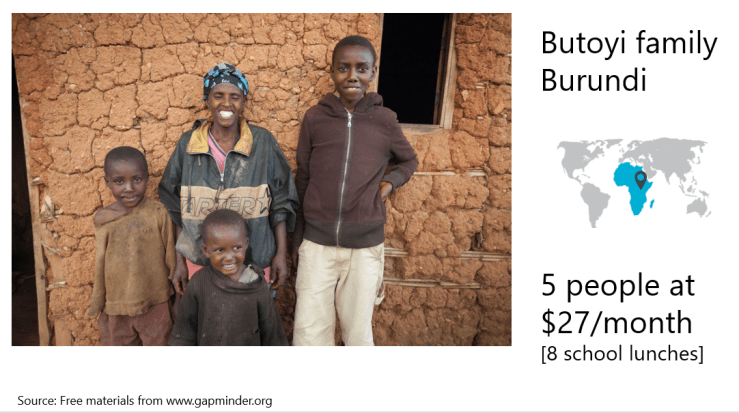
Earlier this week I had 20 minutes each to speak to four classes of middle schoolers about my career. I talked about economic development. I used a presentation (available in full here). Given that it was the antepenultimate day of school, the students and teachers appeared very engaged.

2. Then I introduced the four families in turn, and I expressed their monthly income in terms of the price of school lunches at the middle school where I was speaking. (The Ukrainian family’s monthly income was the equivalent of 3,100+ school lunches, more than the most insatiable student should ever consume.)
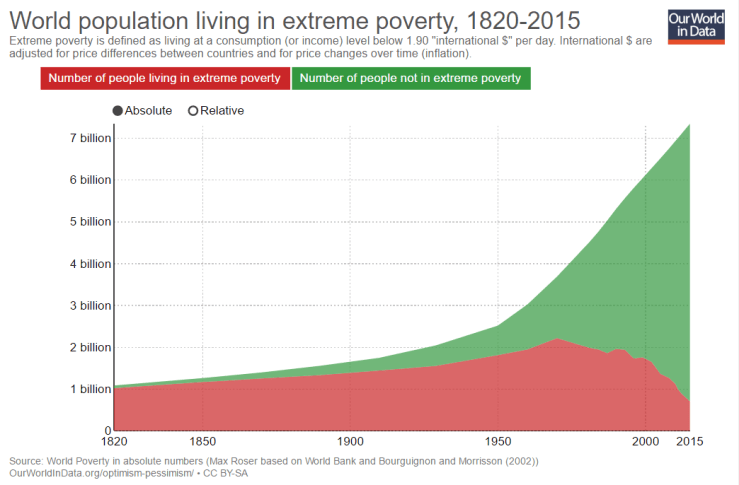
3. Having highlighted the massive gaps in income between families, I invited the students to vote (again, by raised hands) on the number of people in the world currently in extreme poverty. Hint: According to the latest estimates from Cruz et al. (2015), we’re at 700 million.

4. Then I showed — in two ways — how much poverty has decreased over time. First I showed the figure below from Our World in Data. I also showed the evolving chart on income and life expectancy from Gapminder. (Technical difficulties precluded showing the actual evolution over time, but at least I could show screenshots of the beginning and the end.)
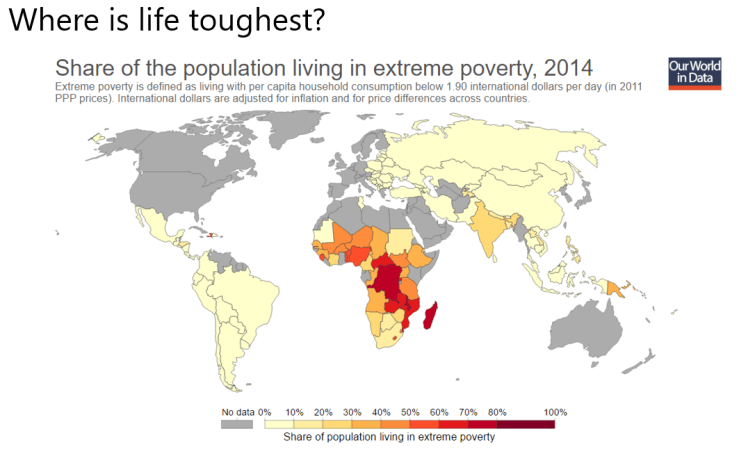
5. I then highlighted geographical concentrations of poverty.
6. Then I gave two very simple definitions of economics:
7. What does economic growth look like? Here’s some of the variation, where countries on the top left are those that grew the most: low income in 1960, high income in 2014.
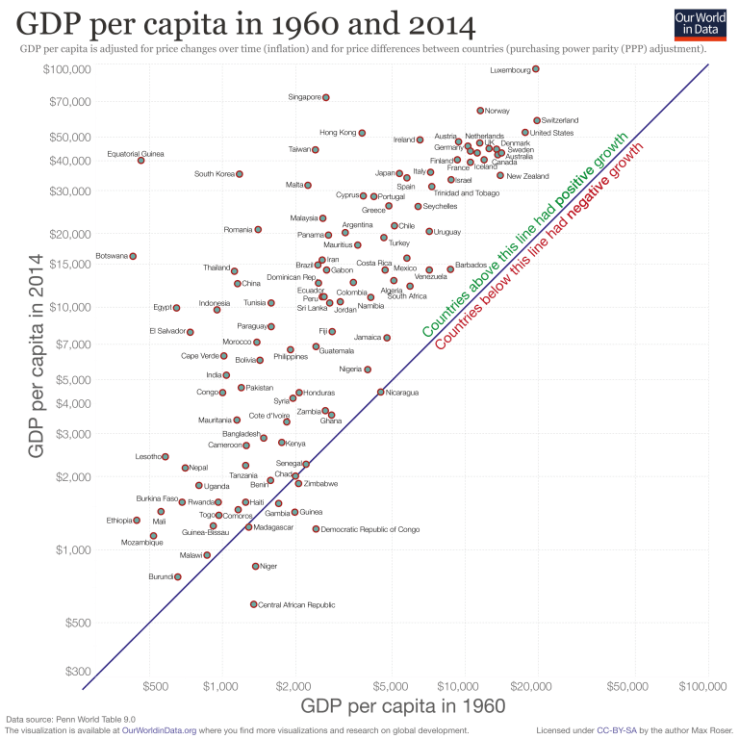
8. I then invited the students to suggest what makes countries grow. We talked about a few possibilities.

9. We then returned to the growth map and differentiated between two high-growth countries: South Korea, which produces goods for trade (I had all the students with Samsung devices raise their hands) versus Equatorial Guinea, which produces a natural resource for trade (oil). We talked about the different implications for inequality.
10. I then talked through the two objectives of the World Bank: to encourage growth and to end extreme poverty. (To be more precise, the “twin goals” are to encourage “shared prosperity” — growth that benefits the bottom 40% of the population — and to end extreme poverty.)
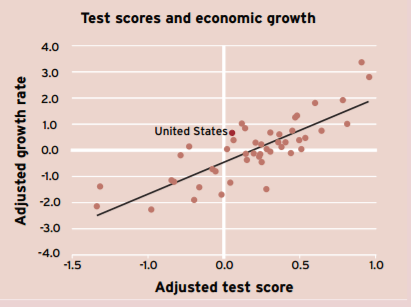
11. Then, since education is an area I work in actively, I highlighted the relationship between learning and economic growth, using data from Hanushek et al. (2008).
12. I then asked how many of the 7th graders could read a sentence: All of them claimed that ability. I then showed data from the Early Grade Reading Barometer on the percentage of 2nd graders in various countries who couldn’t read a single word, which of course predicts future literacy.
13. I talked about what I do specifically, with a few examples (including a few funny stories).
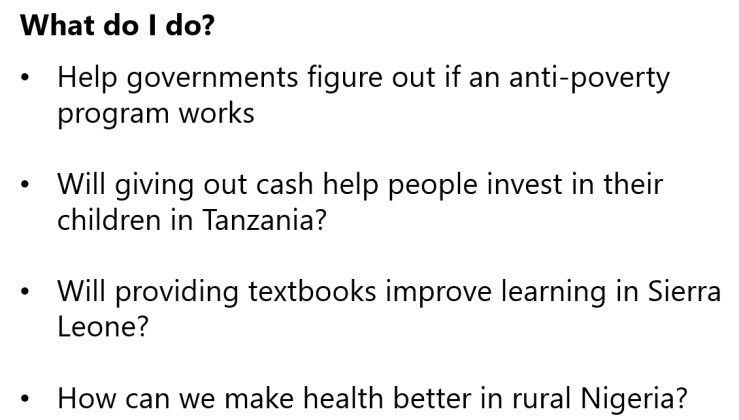
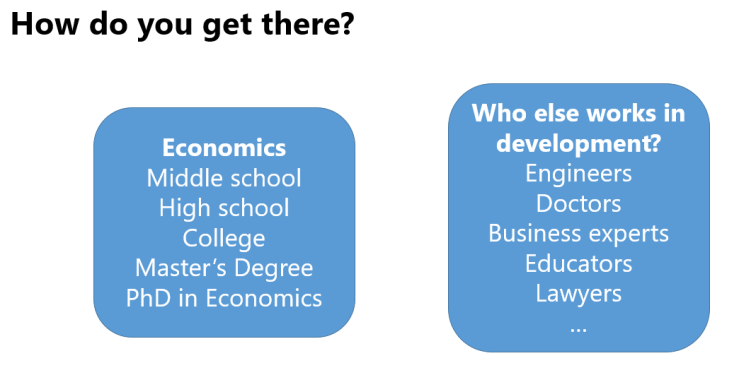
14. And finally, I talked them through how I got to my current job and reminded them that it’s not just economists working in international development.
Many thanks to all those who gave suggestions. I used several of them and would have enjoyed using others if I’d had more time (either to prepare or with the classes).
The next day, I received a number of thank you notes from students. This one took the cake.

